 |
Hyde Heath Weather 2015 |
 |


|
|
|
||||||||||||||||||||||||||||||||||||||||||||||||||||||||||||||||||||||||||||||||||||||||||||||||||||||||||||||||||||||
| Home | ||||||||||||||||||||||||||||||||||||||||||||||||||||||||||||||||||||||||||||||||||||||||||||||||||||||||||||||||||||||
| Weather 2008/9 | Weather 2010 | Weather 2011 | Weather 2012 | Weather 2013 | Weather 2014 | |||||||||||||||||||||||||||||||||||||||||||||||||||||||||||||||||||||||||||||||||||||||||||||||||||||||||||||||||
| Weather 2015 | ||||||||||||||||||||||||||||||||||||||||||||||||||||||||||||||||||||||||||||||||||||||||||||||||||||||||||||||||||||||
|
Hyde Heath weather reports by Gary Beynon based on his own observations & measurements | ||||||||||||||||||||||||||||||||||||||||||||||||||||||||||||||||||||||||||||||||||||||||||||||||||||||||||||||||||||||
| January | February | March | April | May | June | |||||||||||||||||||||||||||||||||||||||||||||||||||||||||||||||||||||||||||||||||||||||||||||||||||||||||||||||||
| July | August | September | October | November | December | |||||||||||||||||||||||||||||||||||||||||||||||||||||||||||||||||||||||||||||||||||||||||||||||||||||||||||||||||
|
December
According to the Met Office, December was
a record breaking warm month. The figures here in Hyde Heath
support that fact completely; we also had a mild December with
the average maximum and minimum temperatures some 3ºC higher
than the figures for the last 10 years on average. To go through
December and only record frost on 2 of the days is most unusual
and it is little wonder that the plants and trees are displaying
signs of Spring. It was not an especially wet month but with
some rain on the majority of days, the ground did not have a
chance to dry out and everything has become soggier and soggier.
There is however no water in the lake opposite the Chiltern
Hospital so presumably the Water Company are pumping out rather
a lot from these upper bore holes. Rainfall in the year as a whole was 715mm somewhat below the 35 year average of 783mm. 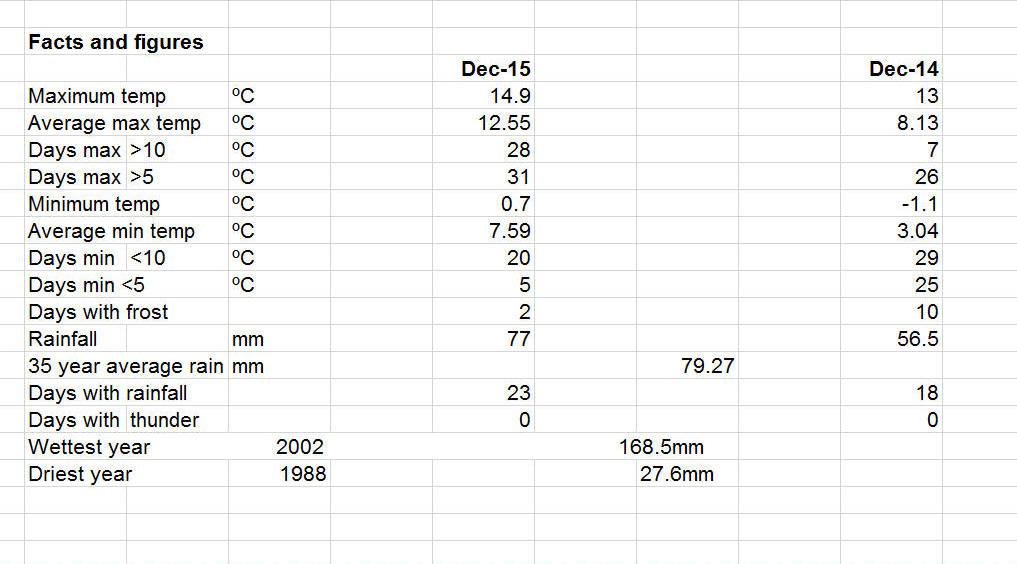 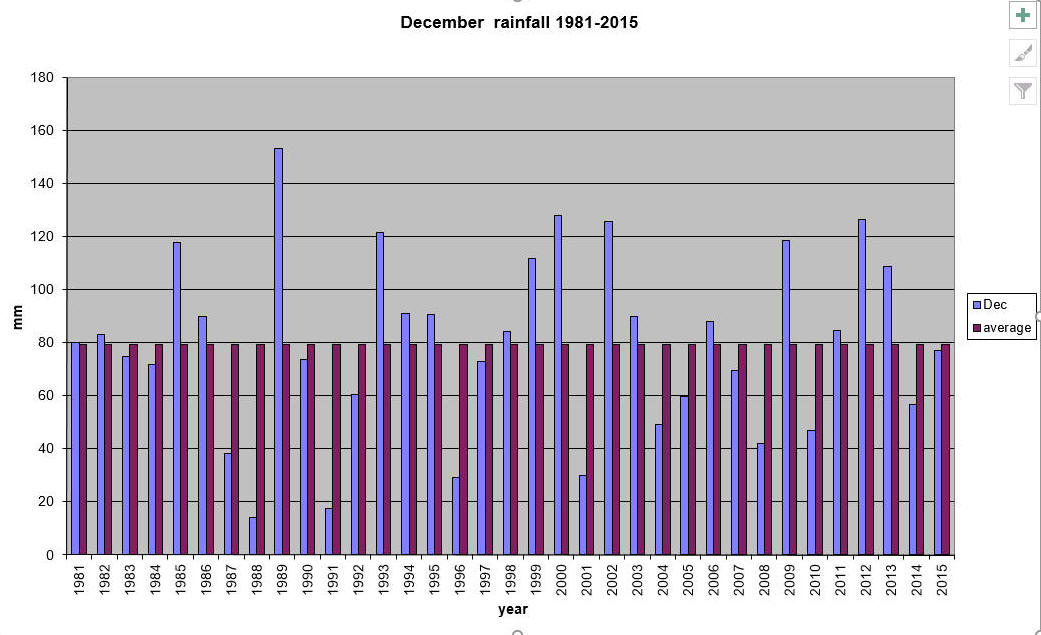 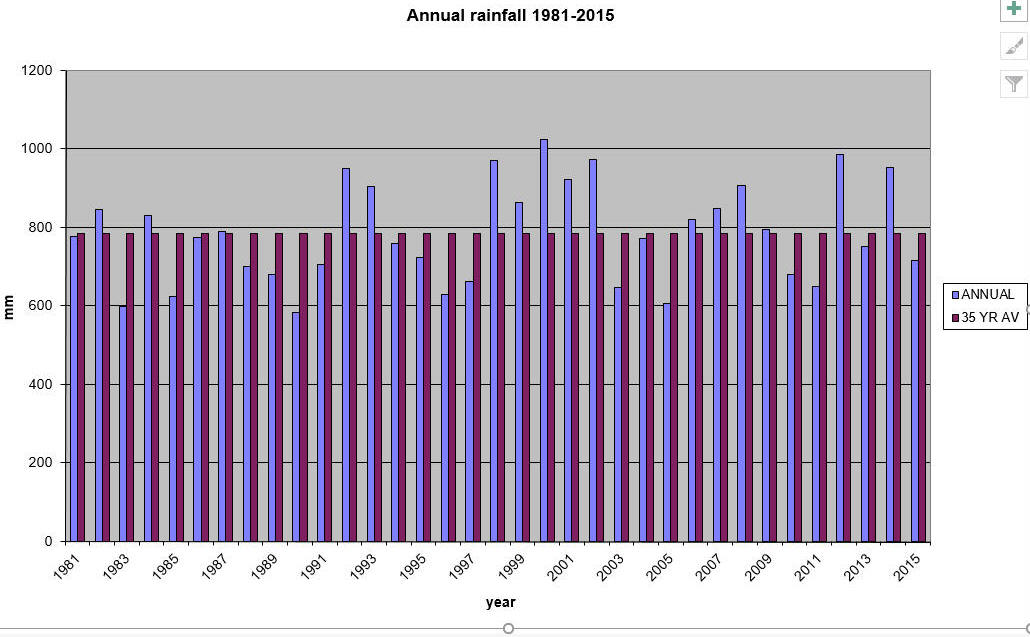 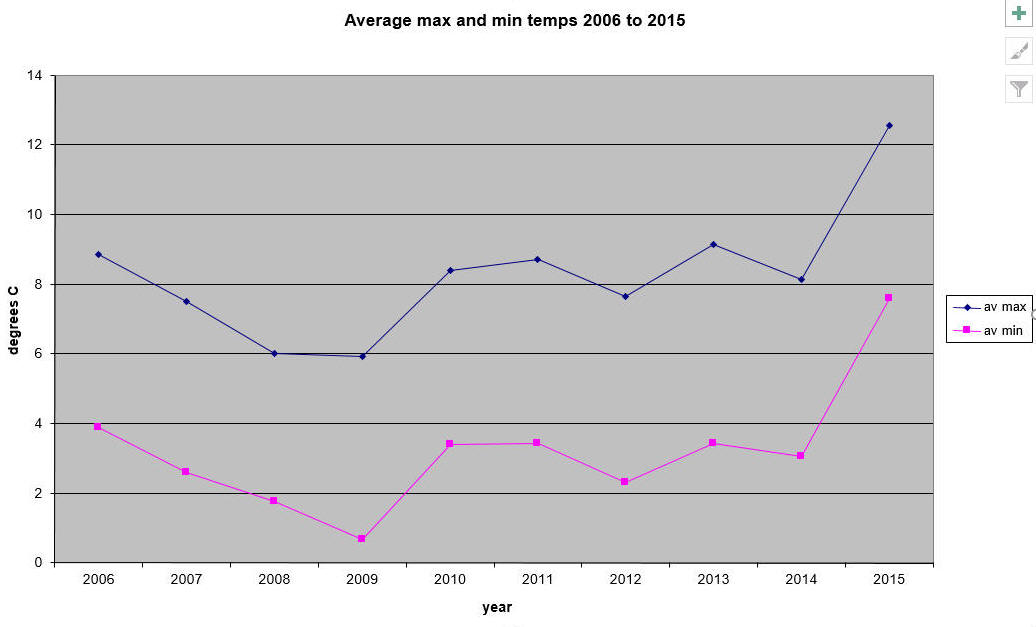 Gary Beynon Jan 19th 2016 November
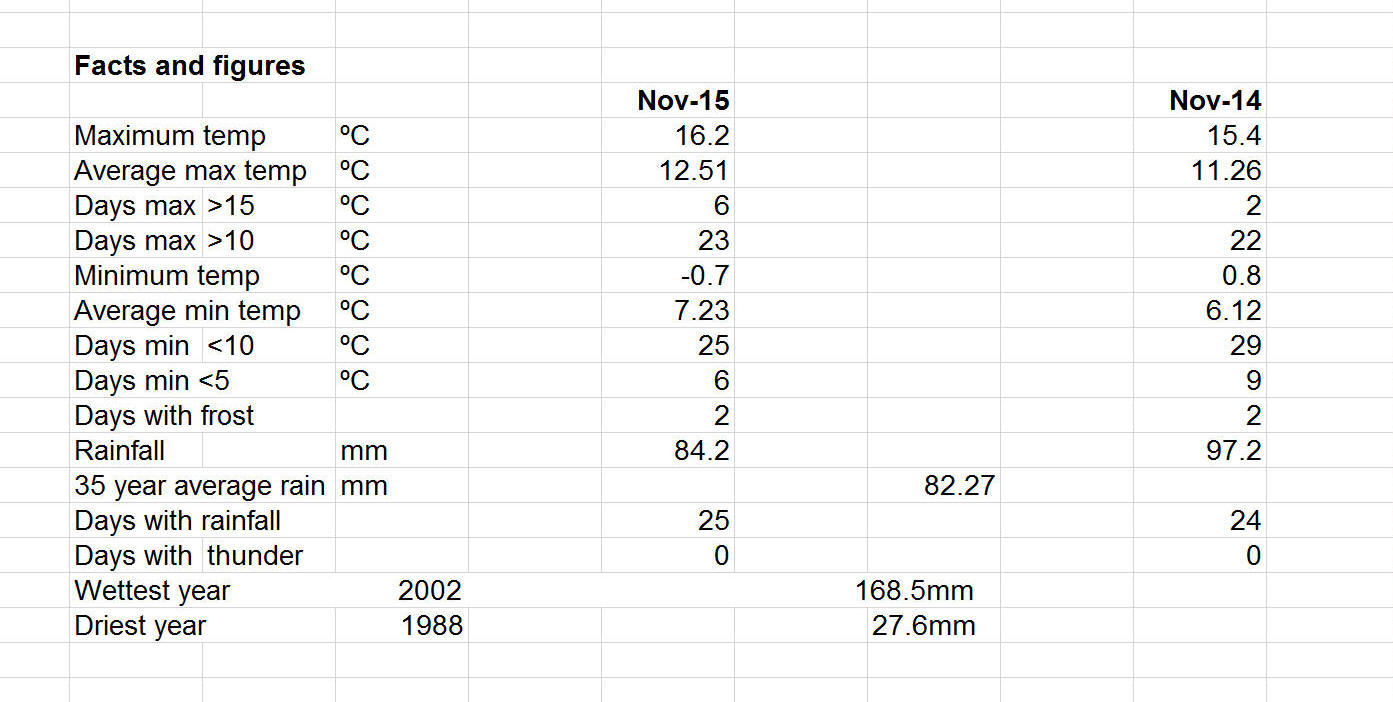
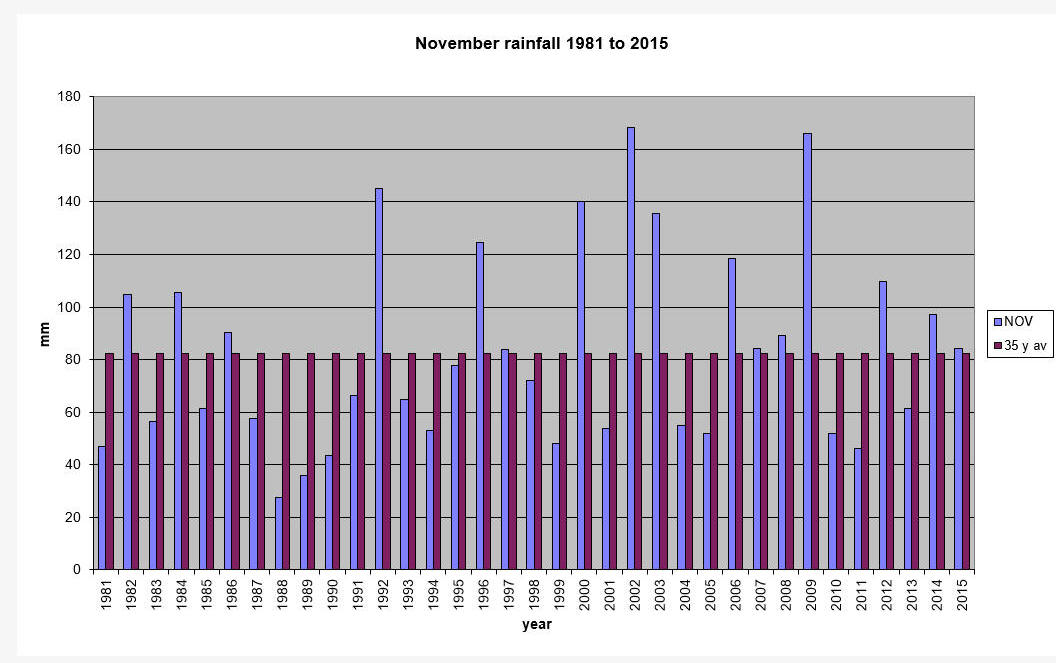
Another month when one might have expected the first signs of Winter
to have appeared but this was not the case. November continued the
pattern of mild weather with some high maximum temperatures and
quite a lot of wet days. The sun was conspicuous by its absence with
23 days that remained virtually cloudy all day. Frosts were not much
in evidence with just 2 in the month. Rainfall was very close to the
average over the last 35 years and we had some rain at least on 25
days of the month. November 2015 was actually very similar to the
same month in 2014 both years being significantly warmer than 2013.
This rather unseasonal weather does throw the plants into something
of a muddle; Siân’s magnolia tree is forming flower buds; it is
presumably going to have a shock in the not too distant future! As I
write this, we are well into December and still the mild wet weather
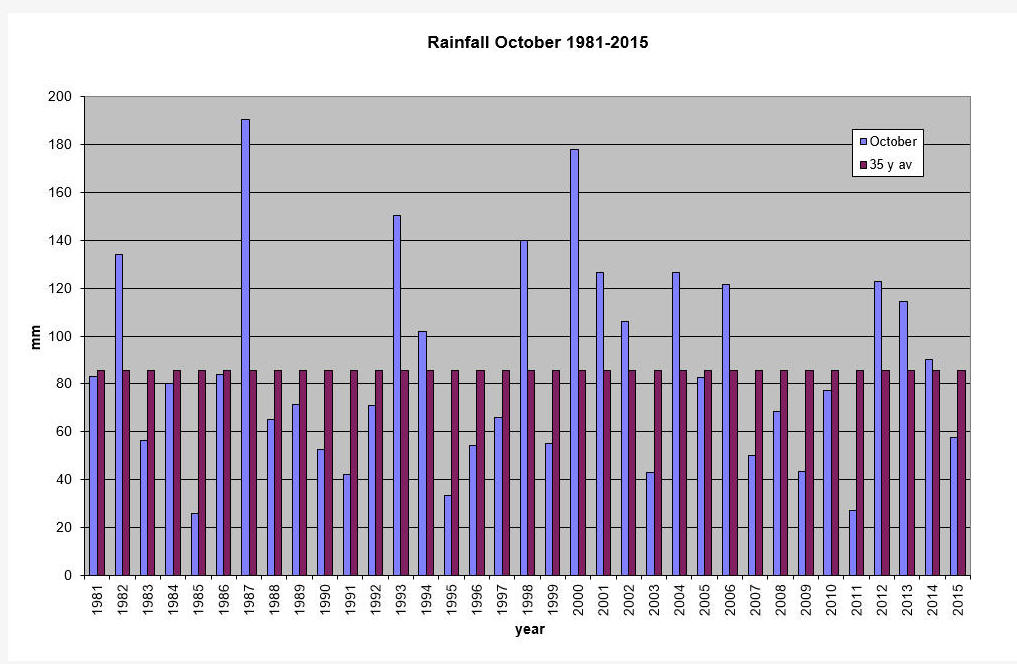
persists. October was a mild month although not as mild on average as 2014. Rainfall was below average and well below last year. Even by month end there were still a lot of leaves on the trees and few of the plants had started to die back. We were still picking tomatoes (from the greenhouse admittedly) and were able to leave picking our main crop of apples until the last week of the month; never been so late. No frosts were recorded and there were 17 days when it was mostly cloudy; it is so noticeable when the sun does come out and you feel a real lift.
Nov 15th
September
Oct 5th
August
Sept 5th
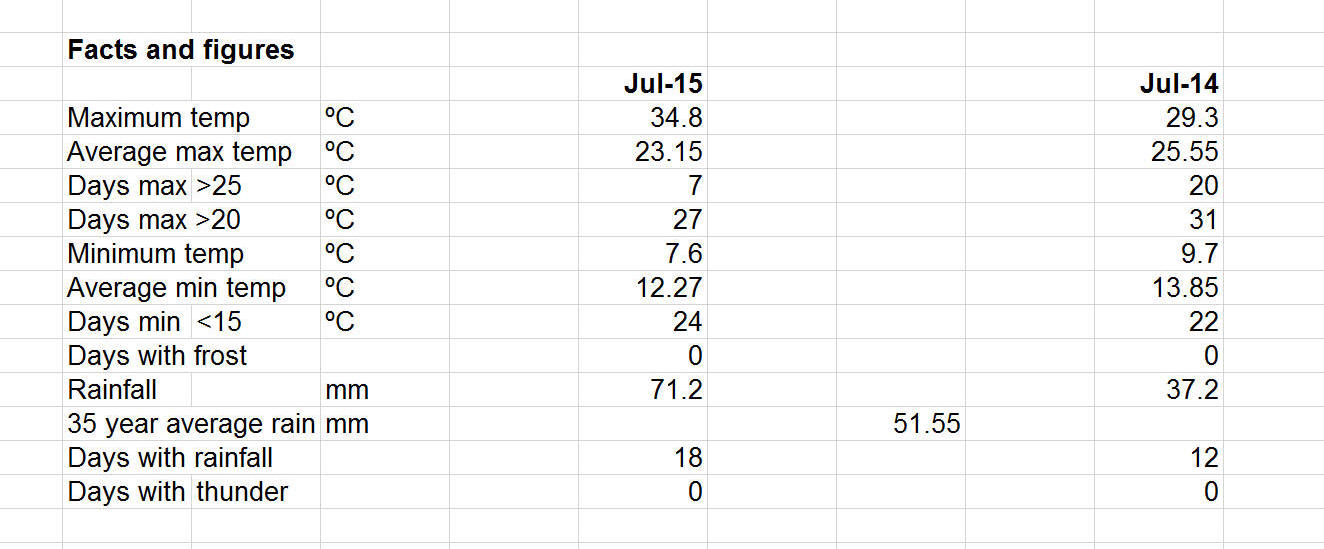
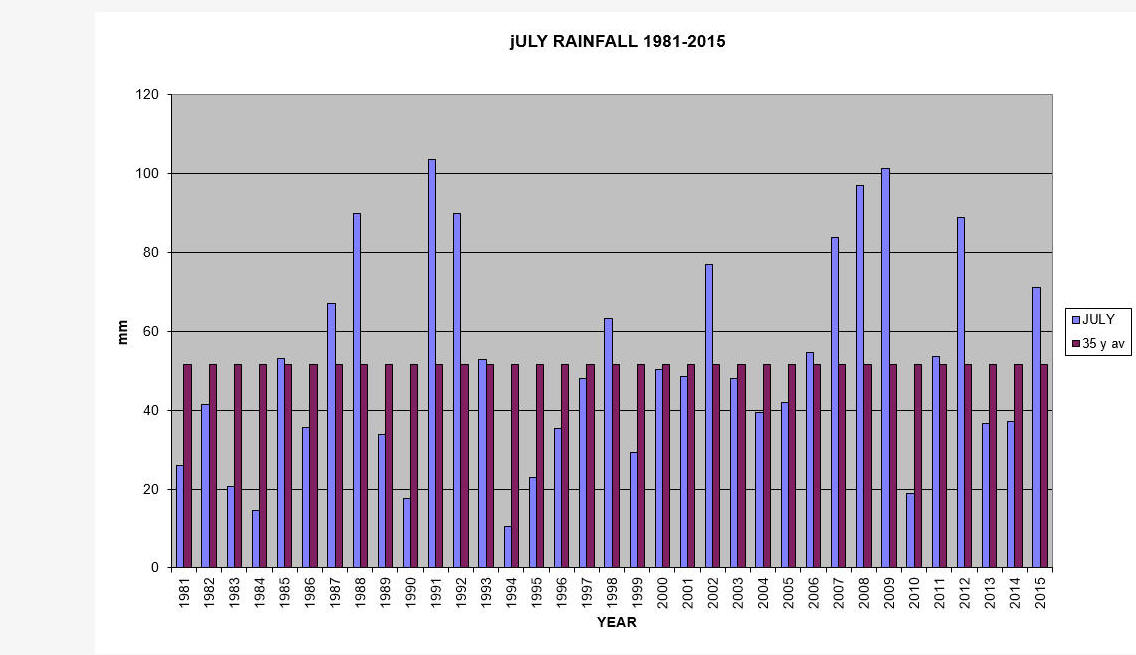
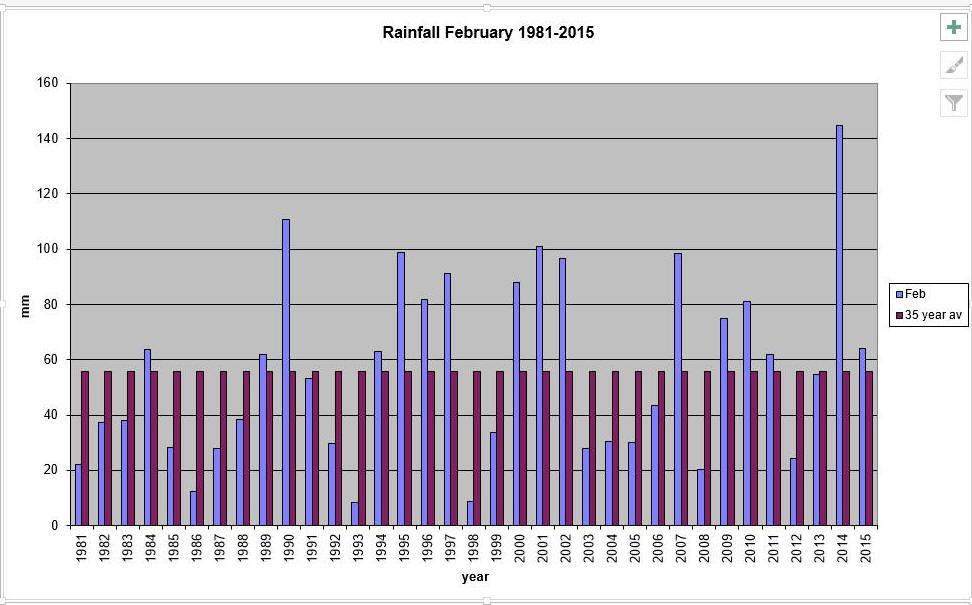
July Not that good a month; very hot at the start and rather mediocre at the end. The temperature soared to 34.8ºC on the first day and stayed in the high 20s for just 4 days before starting to fall away .By the end of the month we were just getting over 20ºC but the minimum temperatures were in single figures. Did you put the heating on or a sweater? Although there was rain on18 of the days, the amounts were quite small----until the 24th when virtually half the total for the month fell in 1 day; 34.8 mm. The 26th saw a further 14.2 mm. At least the grass then looked somewhat greener. Rainfall was above the 35 year average. The wettest July we have had was in 1991 with 103.7 mm and the driest was 2006 with just 8 mm. You will see from the rainfall chart that July is usually wet with just over 51 mm on average. It is a sobering thought that at the end of July we were nearly 6 weeks past the point when the sun was highest in the sky; a cynic would say we are heading towards winter but surely it is better to hope for good August and a late Indian summer.
Aug 2nd
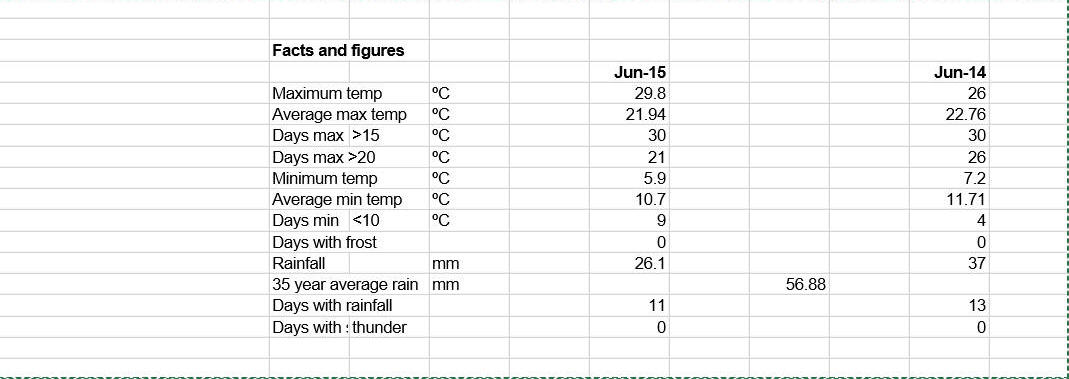
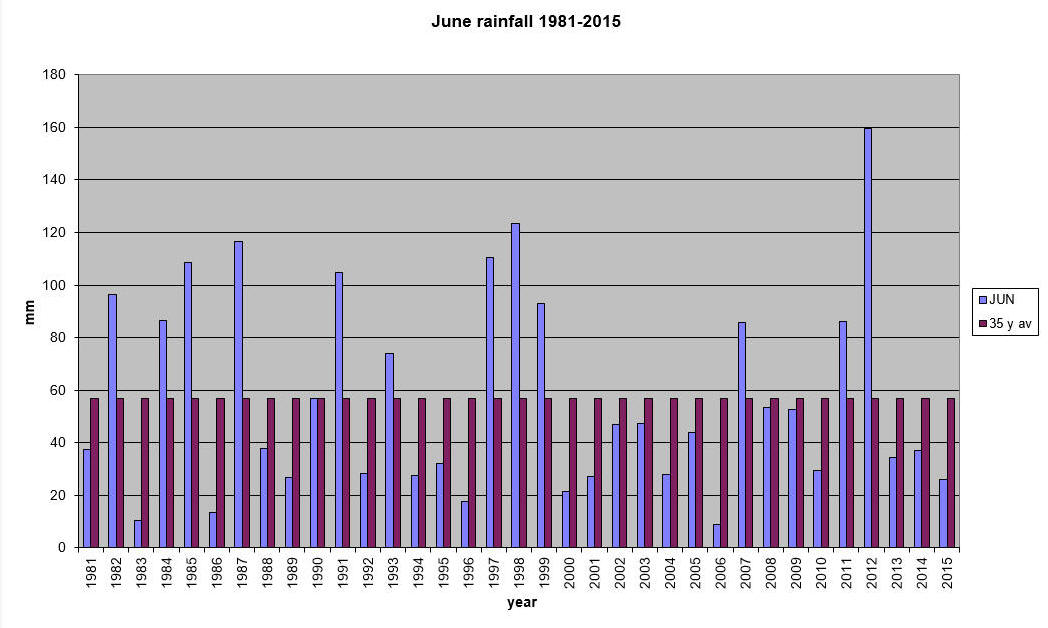
June June was another dry month in what is proving to
be a drier than average year---so far. We have had just 300mm in total
so far this year compared with the same period in 2014 of 547 mm and a
35 year average of 361 mm. June is a drier month anyway with 22 of the
last 35 years being below the average rainfall. Most of this month’s
rain came in just one day, the 12th when 11.3 mm fell. As far
as the temperature is concerned, it nearly reached 30ºC and there was a
low of 5.9ºC. Compared with last year the averages were marginally down.
I suspect that we will look back on June as quite a pleasant month.
July 6th
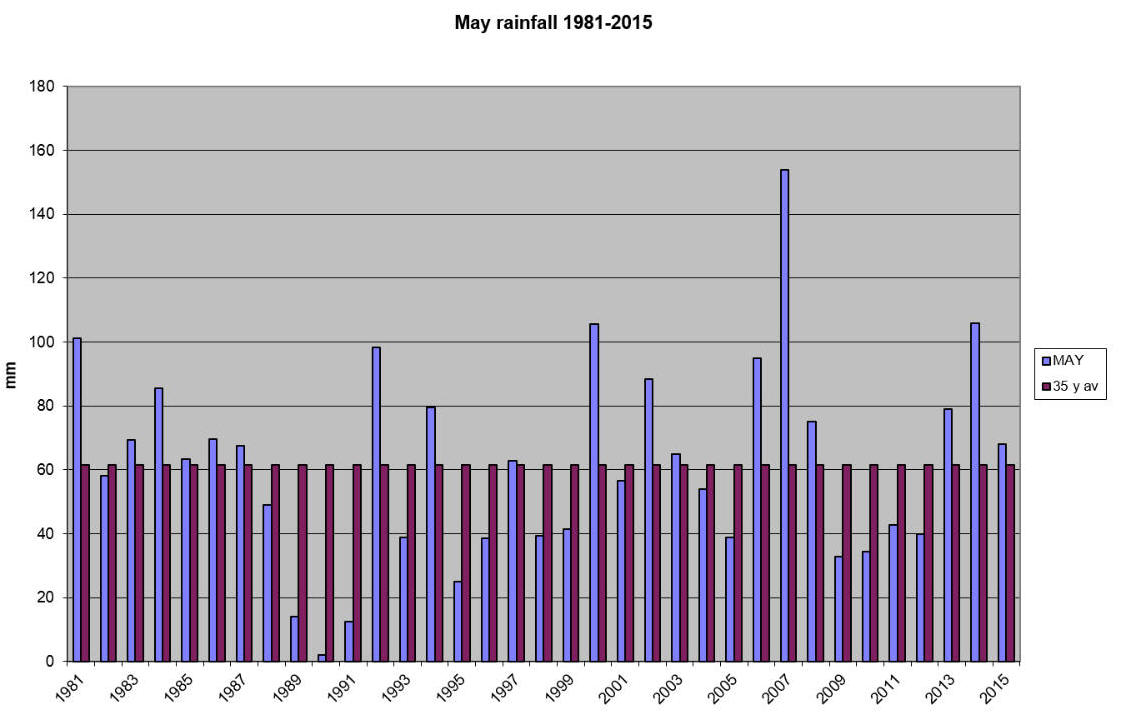
May Not Really the end of Spring/start of Summer that we might have hoped for. The official start of the Met. Office Summer is 1st June and continues for 3 months until the end of August. Let us hope that the “official” bit makes the weather change for the better.This last May was a mixture of wet and cooler weather with an occasional spell of better weather thrown in as a taster. It started off with quite a lot of rain; over 26 mm in the first 6 days. Then there was a patch of dry weather with on or two wet days. Overall rainfall was close to the 35 year average, a long way below 2007 which was the wettest with 153.8mm and way above the very dry 1990 with just 2mm. The temperatures remained fairly constant throughout May but only crept above 20ºC on 7 days. The average temperature was very similar to 2014 but May that year had some days that were a lot warmer.
June 6th
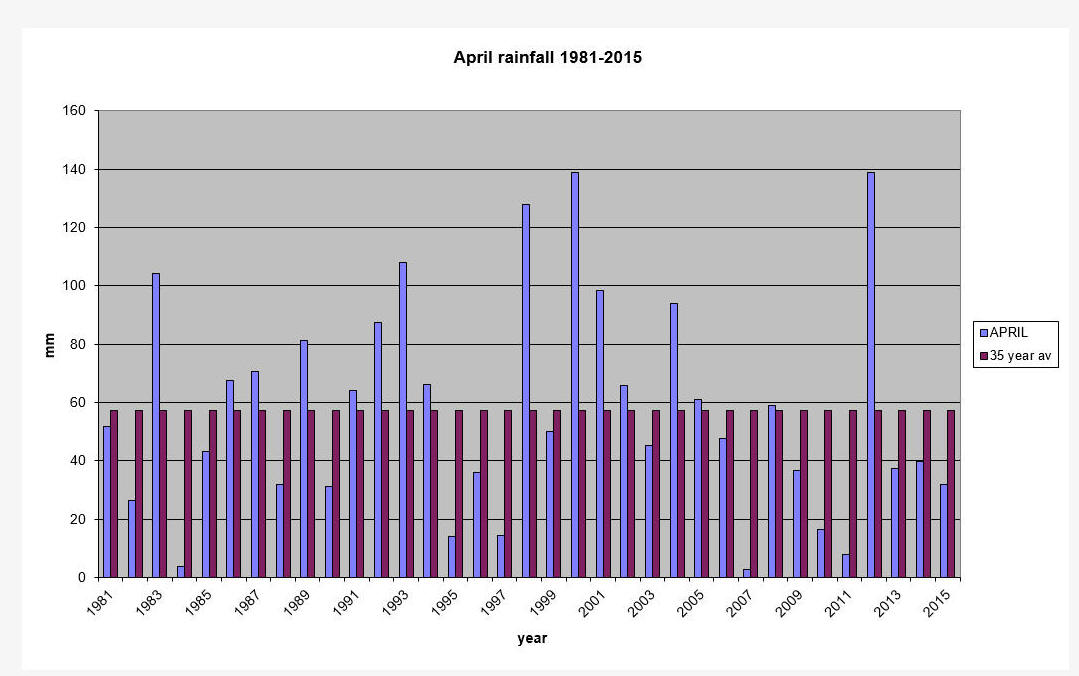
April April was a dry month following March which was also dry. The temperatures were on the whole rather pleasant being especially warm in the first half. The breeze/wind made it feel a lot cooler on days when the thermometer suggested that it was warm. There were some cold nights with frost evident on the cars on 8 occasions. Compared with 2014 the month was actually very similar temperatures and rainfall much on a par. There were only 2 days of frost though. Rainfall was a long way below average and only a fraction of 2000, the wettest April in 35 years, with 139mm rain compared with just 32mm this year. Our driest April was 3007 with just 2.6mm. Facts and Figures
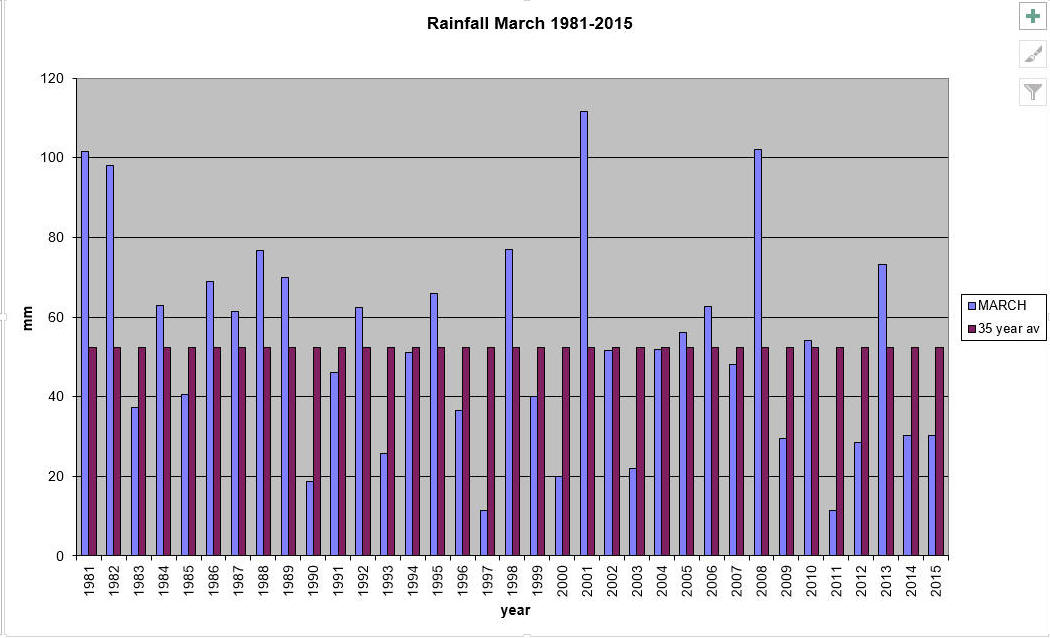
March
March was very much a month of two halves particularly as far as
rainfall was concerned. The first 24 days had very little rainfall,
to be followed on the 25th with more than all the previous days put
together. The last few days were wetter but the month total at
30.2mm was well below the average for the last 35 years. There was a
lot of cloud and most annoyingly on the 20th
when the partial eclipse occurred; if you were lucky you just caught
part of it but it was very dependant on where you were. Temperatures
were quite mild during the day but did fall away over night with
frost on the cars on 8 mornings.
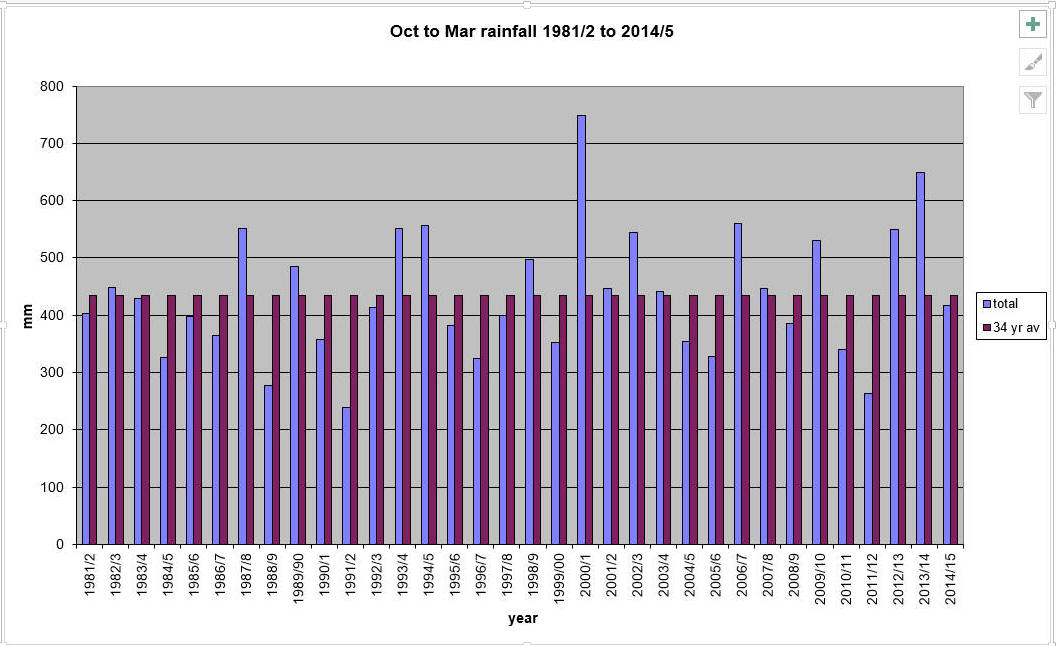
The rainfall over the winter period (October to March when the aquifers are replenished) was just below average and well below last year which was very wet.
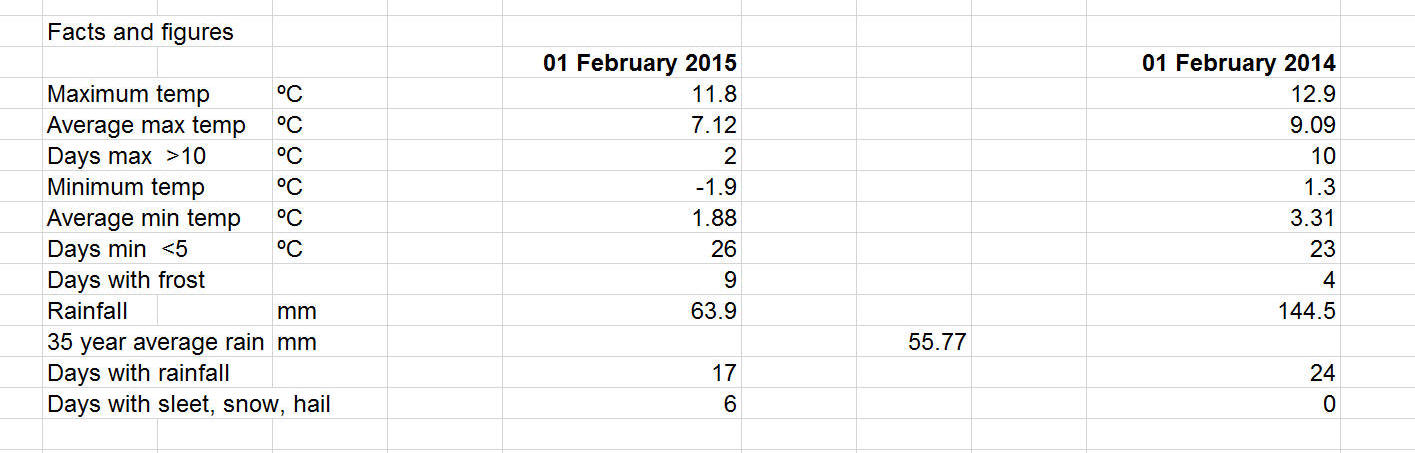
February
February was a dull month on the whole with very little to commend it.
There was not a great deal of rain yet the ground has kept very wet.
Most of the rainfall was accumulated in just 5 days with 83% of the
total. Compared with 2014 it was dry but that was the wettest February
we have had in 35 years. There was not much snow but we did have a
covering on6 of the days. Frost was evident at least on the car
windscreens on 9 days. The end of the month saw somewhat higher day time
temperatures which brought out the first signs of better things to come
with snowdrops and crocus showing.
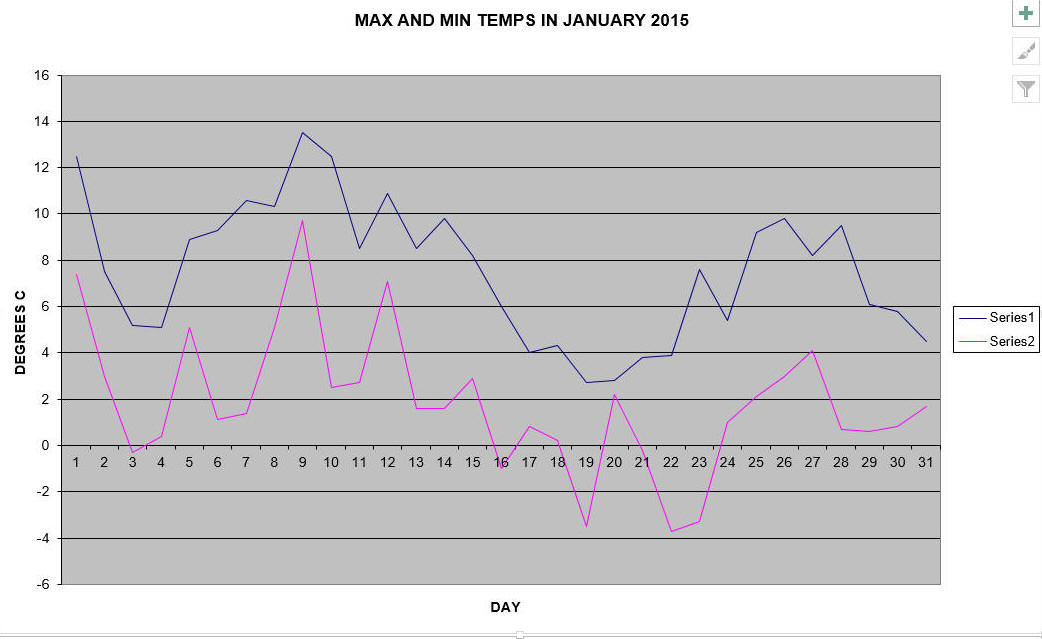
January |
|
There was a distinct decline in temperatures as
the month progressed with an unseasonal high of 13.5ºC on 9th
yet only 10 days later the maximum day temperature only reached 2.7ºC.
The overnight temperatures displayed a similar trend; 9th
seeing 9.7ºC and 22nd -3.7ºC. Compared with 2014 it was a
colder month but the way the days feel are more to do
with what has come immediately before than anything historical.
Towards the end of the month there was a penetrating wind from the
northerly quarter and that made it seem colder. Frost was evident on 13
days compared with 6 days in 2014. Plants and trees may have been fooled
by the warmer weather at the start of the month; some flower heads have
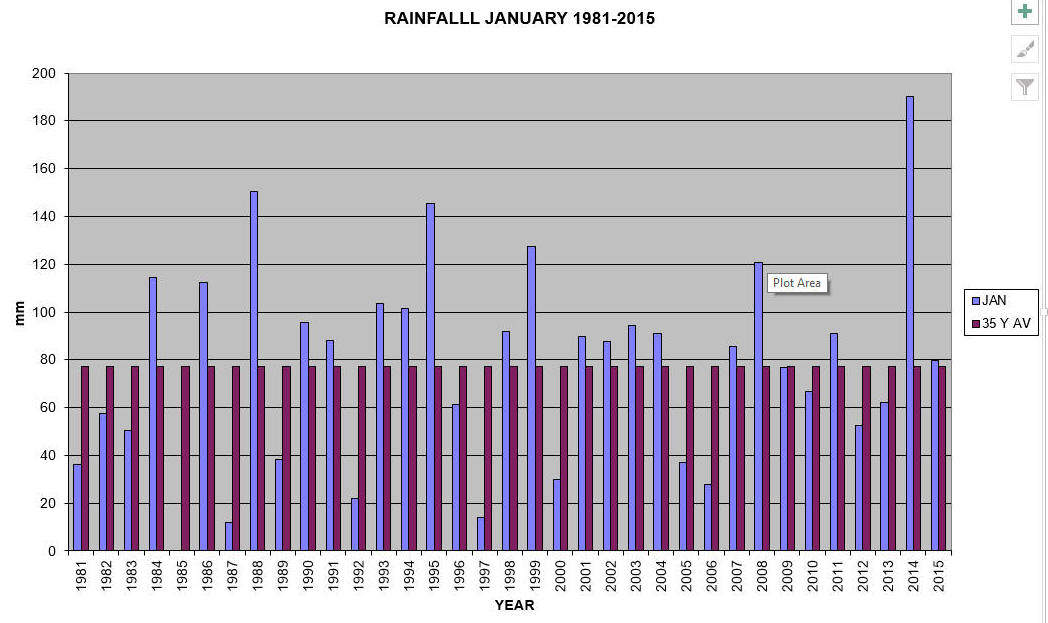
appeared and some twigs have signs of the emerging leaf buds. Rainfall
was very close to average over the last 35 years and a long way short of
last years 190 mm. Rain fell on 23 days with snow, sleet and/or hail on
6 days.
|
|
Gary Beynon Feb 2nd 2015
Top of Page
Home |
| |||||||||||||||||||||||||||||||||||||||||||||||||||||||||||||||||||||||||||||||||||||||||||||||||||||||||||||||||