 |
Weather 2011 |
 |
 |
|
|
Weather 2011 |
|
|
|
Weather reports by Gary Beynon based on his own observations & measurements
|
The Met Office has reported that this December was one of the mildest on record. It has certainly been unseasonably warm as evidenced by the flowers that are still blooming (I still have some rose buds and a number of chrysanthemums) and I can see the bluebell leaves pushing up in the woods at Shardeloes. We did not escape completely though with sleet and wet snow, a number of frosts and some rather slippery roads. Rainfall has returned to normal at long last with slightly greater than average precipitation in the month. However we have a long way to go to make up for the very dry Autumn and so replenish the underground aquafers.
Gary Beynon - Jan 3rd 2012
The Met Office has reported that this November was the second warmest on record in the UK. Their records go back to 1910 and show that November 2011 was the warmest since 1994 (the warmest since 1910); average temperature was 8.7ºC just 0.1º below 1994 across the UK as a whole with various areas (Hyde Heath included) being some 3º above this. The mild temperatures in November follow a relatively mild September and October, which were the 6th and 8th warmest on record respectively. This has added up to a warm autumn, with provisional figures showing the UK average temperature was 11.2ºC making (these 3 months) the 2nd warmest on record, behind 2006 when the mean temperature was 11.4ºC. My data for Hyde Heath mirror the Met Office statistics although I certainly cannot go back anywhere as far as they do! This November was mild with a maximum temperature of 16.1º and a mean of 12.35º. Rainfall was below average and continued the dry period that we are currently experiencing. I saw frost on car roofs on just 2 mornings compared with the 12 mornings last year. 2010 also had snow in November on 4 days, admittedly not a lot but….. What does this mean for December? Wait until the end of the year and we will know!
Gary Beynon - Dec 5th 2011
October was a dry month; in fact the driest month here in Hyde Heath since 1985. It was well below average in terms of rainfall, only a third and only 14% of the highest rainfall I have recorded in October since 1981. It was also a warm month; the Met Office were reporting temperatures of 5º above average; I can’t process that much data but compared with the last few years our average maximum temperature was some 2.5º higher. The maximum temperature reached 24.3º early in the month and it has been mild throughout. Frost is always difficult to record at this time of the year as its presence is so dependant upon locality. I believe that just 1 morning showed a frost in my part of the village. In 2008 there were 7 days of frost in October. The facts and figures:
Gary Beynon - Nov 1st 2011
A month of two halves; the first 2 weeks were mainly wet with a lot of cloud, the last 2 weeks had far fewer days with rain and many sunny periods with the last 4 days being unbroken sunshine. Temperatures kept well up with maximum values above last year and the minimum a respectable 7ºC. Rainfall was about the same as 2010 but looking at the total so far this year, we are not that far from the recent average. Pleasant though it was at the end of the month, I hardly think that the BarBQ summer we were promised earlier in the year lived up to the forecast. Now a cold winter is being predicted! We shall see. Someone has postulated a theory that the coldness of the winter is directly related to the amount of activity on the sun’s surface; this year the activity level suggests cold. We will review the situation in April 2012; this is the advantage of reporting what HAS happened rather than what WILL happen. The facts and figures
Gary Beynon - Oct 11th 2011
What can one say about August? It was nowhere near as wet as last year but it was the second wettest month so far in 2011. It started off with great promise with temperatures in the high twenties but then slipped back rapidly to give a period of temperatures in the low twenties, a great deal of cloud and rain more often than not. From that perspective it was not dissimilar to 2010 and I suspect fairly typical of many Augusts. Rainfall was above the 30 year average but less than half of the amount we had last year. 10 years ago the month was poor, 5 years ago just the same. A quick scan back through my records shows that 2002 and 203 were not bad; reasonable temperatures and low rainfall, but 1997 looks as if it was a “good” August. Perhaps we shouldn’t expect too much in the summer holidays. I wonder why people prefer to go abroad?
Rainfall chart for last 30 years
Gary Beynon - Sept 4th 2011
July was a real mixture of weather. More dry days than wet ones but there was a lot of rain on a few of the wet days. Temperatures were high with an average maximum of just over 22ºC and 27 days with a maximum greater than 20º. It will not however go down as one of the memorable months. As I look at the comments that I have made for each day I see that even the dry and warm days have “mostly cloudy” or “bright periods” and very few say “sun all day”. Early on in the year there were predictions of a very hot summer; April (hardly into summer) was warm and pleasant but May had rain on 50% of the days, June was worse and July was disappointing. As we move through August there has not been a great deal to celebrate. The rain we have had probably saved the cereal crops but now we need some dry weather to ensure it is all harvested. How often have you needed to cut your lawn this year? Mine has not grown that well and has not needed to be cut any where near as often as is usual. This tells us a great deal about the weather at the crucial growing times in the year.
The rainfall chart is shown below
Gary Beynon - Aug 24th 2011
The drought had to finish at some time and I suppose June was as good (or bad) a time as any. After 3 months of very dry weather and a total of only 61.7 mm, June was the second wettest month of the year so far with 86.1 mm. At a late stage I thought that the rainfall was going to exceed January but it did not make the 91.9 mm necessary. It was another month of extremes; the temperature went up to 30.3ºC on the 27th and fell to just 5.9ºC on the 11th .The lowest maximum temperature was 14.8ºC , a difference of 15.5º compared with the hottest day. A lot of days had some rain with 22 days in total. Most of the rain fell on 4 of the days showing 51.5 mm out of the 86.1 mm total. This year was not dissimilar from June 2010; temperatures were similar although the mean was 2º lower.
June Rainfall - 1981 - 2011 - average over the 30 years 59.78mm
Gary Beynon - July 2nd 2011
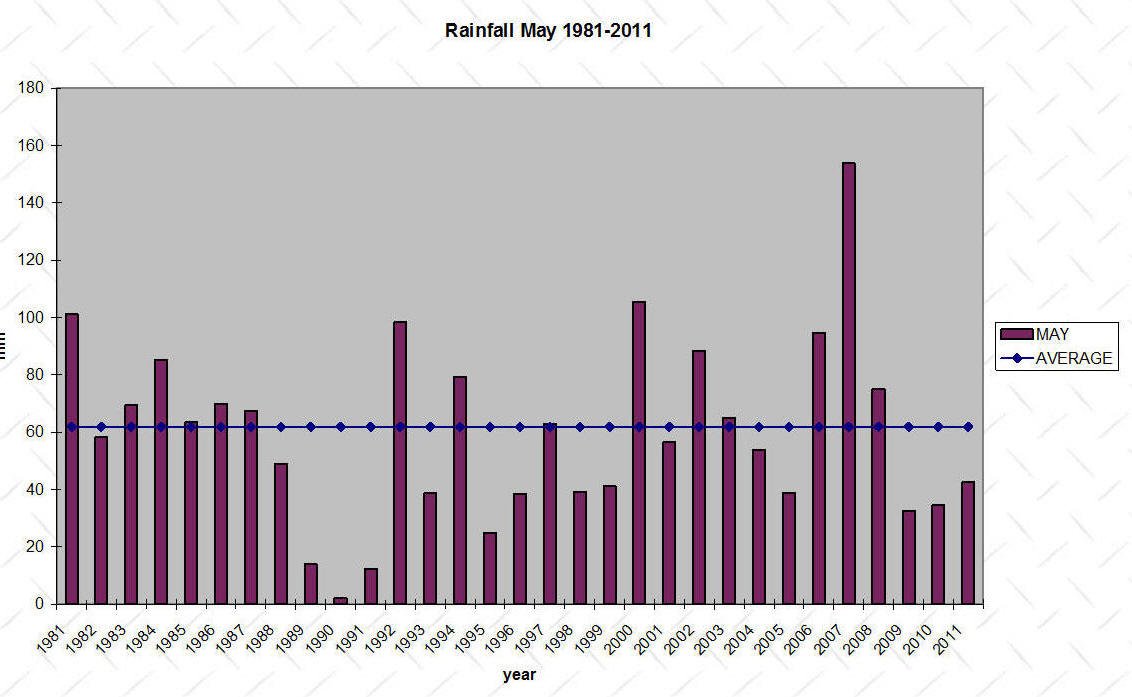
Yet another dry month in terms of total rainfall although, surprisingly, there was rainfall on 13 days of the month. Rainfall was below my 30 year average but May has been quite a strange month over the years being characterised by a few years of very heavy rainfall and many that have been moderate; have a look at the chart and you will see what I mean. The gardens, the fields and the lack of grass growth all tell their story about the small amount of rain. The majority came in just 2 days of 16 and 17 mm; how much went in and how much ran off is debatable. Just 1 air frost in an otherwise warm month but tempered by the strong breeze that we had on many days making it feel cooler than the temperature on the thermometer. The maximum temperature was below that in April but the lowest maximum temperature kept above 15ºC throughout the month. Pressure remained above 1000 mb on every day and the relative humidity(a measure of the moisture in the air) fell to 28% on May 3rd. It is more usual to have a RH of 60% in the day with 90%+ early in the morning. The facts and figures are shown below:
Gary Beynon - June 5th 2011
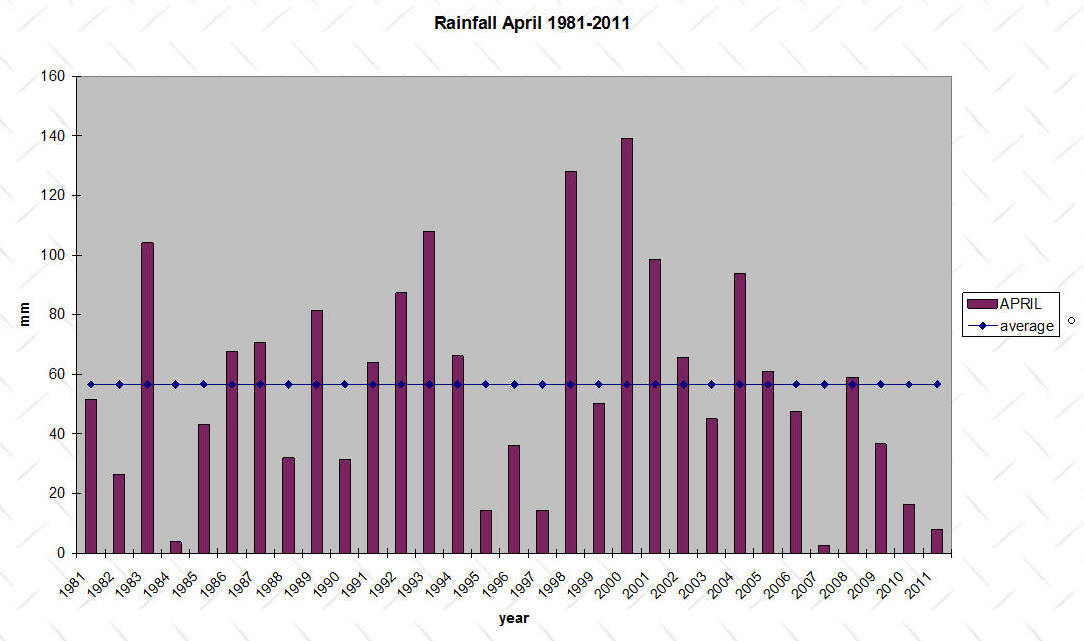
This was yet another very dry month to follow a whole succession of months with below average rainfall. Not only was it very dry, but also warm with the Met. Office telling us that it was the warmest April for ages. My records only go back 31 years now and I have (yet) to put much of the data into Excel so any longer term analysis is very difficult. However, compared with last year the average maximum temperature was some 3.3ºC higher which is a lot. April shows a big variation in rainfall over the years; the wettest I have recorded was in 2000 with 139mm and the driest was 2007 with just 2.6mm. You will see from the rainfall graph that there have been other dry Aprils so it is not unusual. May in the past has almost always been wet; in the last 30 years the minimum amount of rain has been 2 mm, the wettest 153.9 mm (in 2007; our driest April!) and the average 60.48 mm. I wonder what this May will be like. So far (5th) the dry period is continuing.
Gary Beynon - May 5th 2011
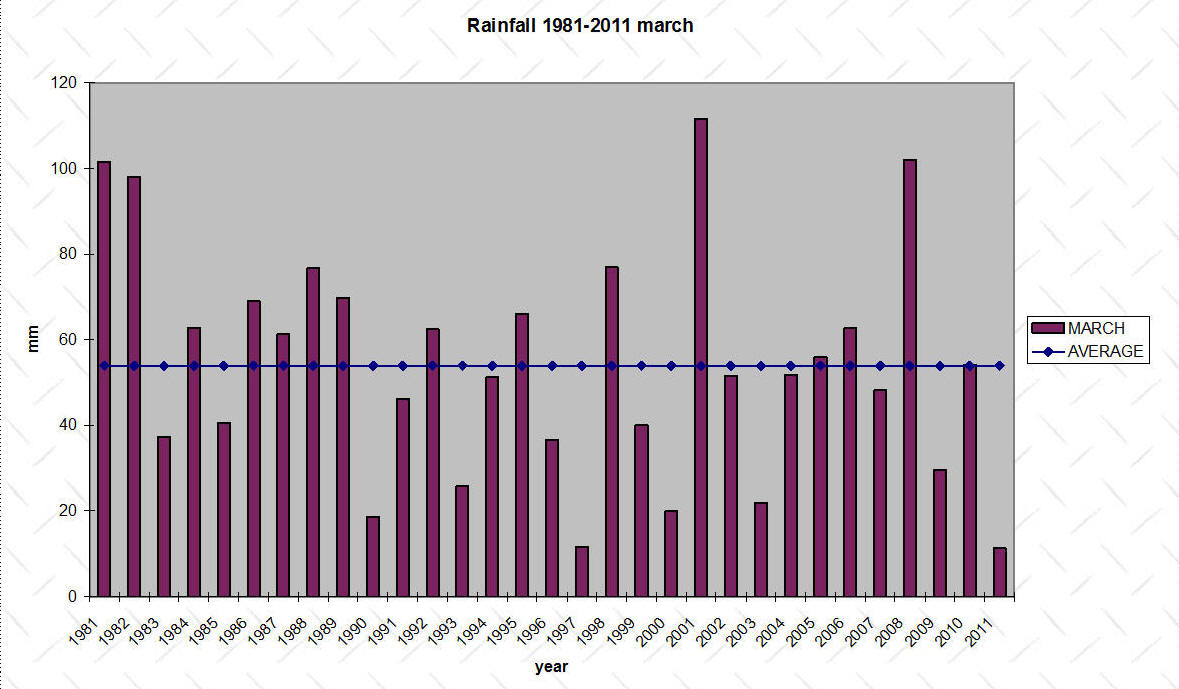
March was a very dry month with only 11.3 mm of rain recorded; this is the driest since 1997 when there was a similar amount. This is well below the month average of 54 mm. Actually the month followed the pattern of the winter wet months; they weren’t very wet with a below average rainfall over the 6 months that can generally be considered to be the ones that top up the water table. There was a big temperature variation from a maximum of 4.5ºC at the start to a dizzy 17.6ºC on the 25th. There was frost evident on 8 days. The pressure was consistently high being over a 1000 millibars for all but 2 days. All in all it was quite an interesting month.
The rainfall charts are shown below
Gary Beynon - April 21st 2011
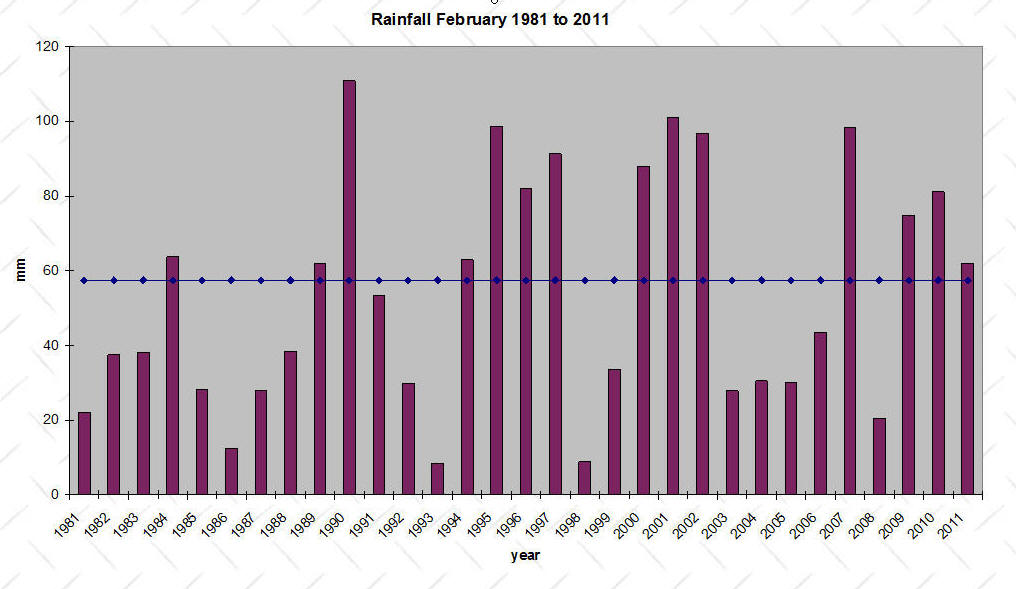
February could best be described as a mild (comparatively speaking), grey and damp month. A month that we were all glad to see the back of! During a month when so many days are overcast it is always such a lift when the sun does come out. I recorded just 8 days when the sun made an appearance and for most of those days it was only briefly. There was little frost which is always surprising but not backed up by the records. The most days of frost we have had in the last 6 years was 14 and most years were in single figures. With winter starting early it did seem that we were going to have a ”bad“ season; so far not the case and anything we have now can only be short lived---surely?
Rainfall chart below
Gary Beynon - March 11th 2011
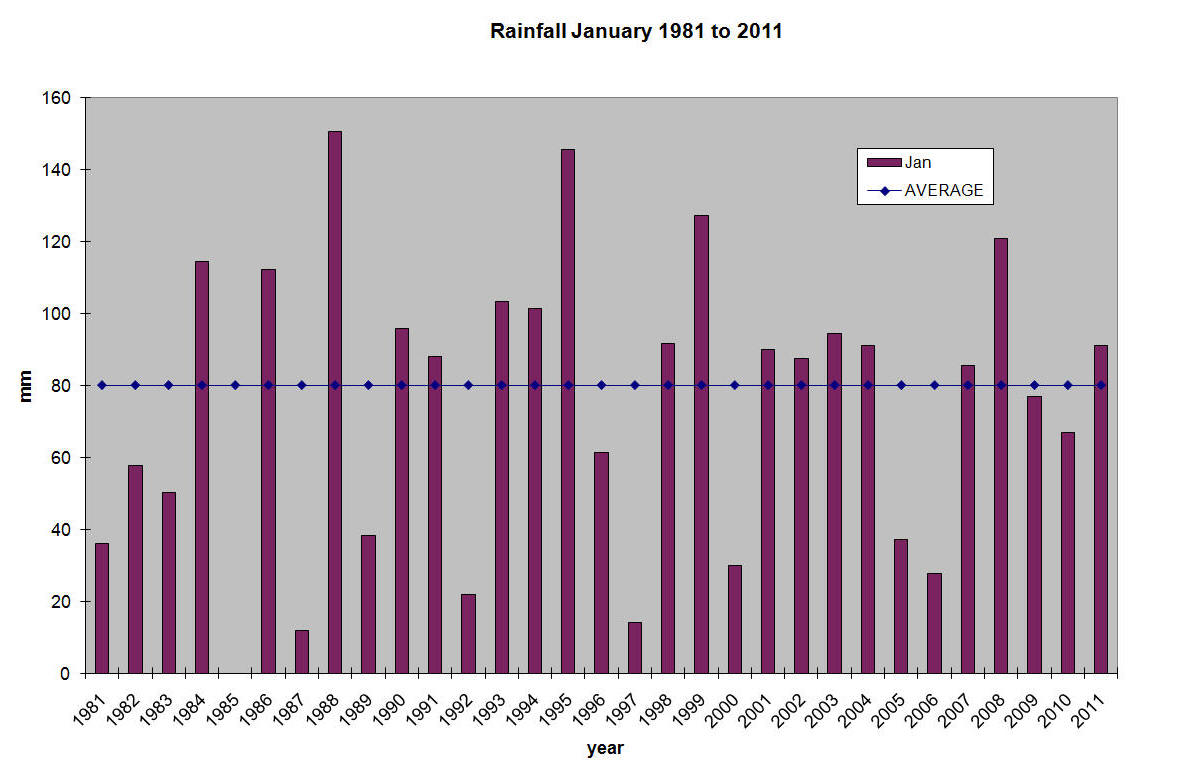
Rainfall was just above average, temperatures were also above the last few years but overall I suspect that we will remember-if we do- January as a dismal month. I recorded 23 of the days as cloudy and all had some precipitation. When there is a bright sunny day you realise just how much you have missed the brightness. The average temperature, both maximum and minimum, were “warm” compared with last year and on a par with 2007. Last year there were 8 days on which snow was falling compared with just 2 in 2011 and then it was only flurries. December’s snow may have heralded more in January but it was not to be the case. Just goes to show how difficult it is for the forecasters to predict patterns in our weather. The variation in temperature through the month was also significant. We had a dizzy high of 13.1ºC and a low of -1.8ºC. There were 5 days with a max of >10ºC whereas in 2010 we managed only 8.3ºC.
The rainfall chart is shown below.
Gary Beynon - Jan 6th 2011
|
|||||||||||||||||||||||||||||||||||||||||||||||||||||||||||||||||||||||||||||||||||||||||||||||||||||||||||||||||||||||||||||||||||||||||||||||||||||||||||||||||||||||||||||||||||||||||||||||||||||||||||||||||||||||||||||||||||||||||||||||||||||||||||||||||||||||||||||||||||||||||||||||||||||||||||||||||||||||||||||||||||||||||||||||||||||||||||||||||||||||||||||||||||||||||||||||||||||||||||||||||||||||||||||||||||||||||||||||||||||||||||||||||||||||||||||||||||||||||||||||||||||||||||||||||||||||||||||||||||||||||||||||||||||||||||||||||||||||||||||||||||||||||||||||||||||||||||||||||||||||||||||||||||||||||||||||||||||||||||||||||||||||||||||||||||||||||||||||||||||||||||||||||||||||||||||||||||||||||||||||||||||||||||||||||||||||||||||||||||||||||||||||||||||||||||||||||||||||||||||||||||||||||||||||||||||||||||||||||||||||||||||||||||||||||||||||||||||||||||||||||||||||||||||||||||||||||||||||||||||||||||||||||||||||||||||||||||||||||||||||||||||||||||||||||||||||||||||||||||||||